Variable Stars
Written by Peggy Wargelin, Wolbach Library, 2018.
Leavitt identified variable stars by gathering five images of one section of sky from different nights (four glass negatives and a positive print of a fifth) and overlaying each negative in turn on the positive print.
Stars of constant brightness neutralized the differences between their positive and negative images to look gray, while variables showed with black or white rings to the practiced eye, where they did not completely overlap (Sobel, 2016, p. 114). Once identified, changes in the variable’s brightness and its period were determined by comparing plates taken of the same section of sky on different dates through a loupe (magnifying glass) and measuring the diameter on each night as an approximation of its brightness.
You can see some stars with this halo effect in Figure 1c from the edge of the Small Magellanic Cloud.
Figure 2 shows a detail from photographic plate a2969 demonstrating Leavitt's method. She labeled each star’s dot with a letter, and then measured that star's magnitude. Marks were made on the back of the glass plates to avoid damaging the photographic emulsion on the front side. Plates were used many times, so marks were washed off the glass as needed. The remaining notes on this plate look as if it was used in several different analyses over the years. (Fortunately for historians, these were not completely cleaned!)
Figure 3 shows part of a page from November 2, 1906 referencing the plate in Figure 2. For each plate, she would draw a detailed chart of the stars she was examining. Note she draws the star chart in the notebook as the stars would appear in the sky - the mirror image of the way they appear in her markings on the back of the plate. (See circled “u” and “v” in Figures 2 and 3.)
On this same notebook page, shown more fully in this image of Figure 3 and 4, the column indicated by "4" shows a list of the magnitudes determined for each labeled star (Fig. 2 and 3).
The magnitudes for “u” and “v” are shown in the red rectangle. Leavitt measured the star magnitudes, using the diameter as an approximation, and then that measurement was calibrated to a standard scale using a reference star of known magnitude somewhere in the image. (See "fly spanker" below in Figure 8.)
Comparing Plates
Once a variable star had been identified, Leavitt conducted a survey of existing photographic plates that looked at that area of the sky to examine how its brightness varied over time. The star’s brightness would be measured on multiple plates to find its period of repetition and maximum and minimum brightness.
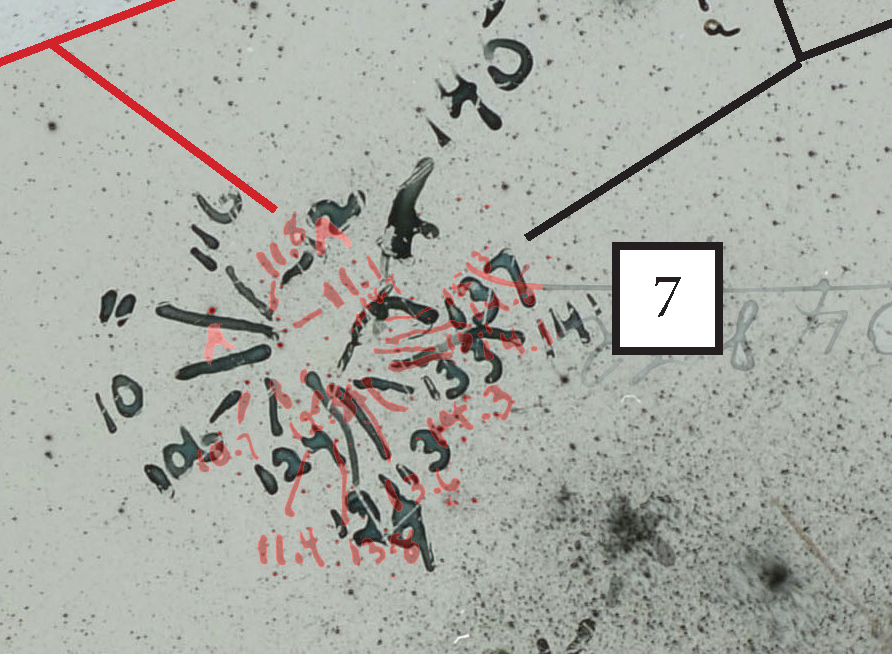
As an example, see Figures 5 and 6 below, taken eight days apart.
Figure 5 shows a detail from Plate b20650, exposed for 4 hours on October 20, 1897. Figure 6 is a detail from Plate b20678, of exactly the same stars, exposed for 4.5 hours on October 28, 1897.
When 5 and 6 are overlaid in Figure 7, with the small section from Fig. 5 changed to transparent red, note the extremely small changes in magnitude seen between the two dates: 11.6 to 11.8, 11 to 11.1, 10.6 to 10.7. The images are shown ~actual size; the full plates are 8" x 10".
If the exposure time was different on comparison plates, as in this case, Leavitt would use a “fly spanker” (so called because it was too small to be a fly swatter; see Figure 8) to calibrate the size of a reference star on each plate. This identified a standard conversion factor for that photo to a fixed magnitude photometric scale.
Thus, if a star with known magnitude 5 looks like a 7 in its exposure on a plate, the astronomer can compare all other stars on that plate to the known star to determine their standard magnitudes at that exposure.
As can be seen in Figure 9, even though these plates are taken of stars in the same section of sky with the same telescope with the same settings, the stars do not exactly line up when the two are overlaid. This type of variation between plates is due to instrument effects. (See Instrumental Effects section on the following page.)
The aligned area in Figure 7 has been included again here to give an idea of how an area even a few inches away could be shifted.
Figure 9a shows plate Plate b20650 mapped to the night sky using modern astronomy software (latest edit 4-26-19), with stars from the TYCHO-2 Catalog (2000) marked. You can see that some of the faint variable stars Leavitt had identified are missing here, but they are probably included in additional faint variable star catalogs and the Henry Draper Catalog. This figure will be updated as additional catalogs are accessed.
Publishing the Results and Creating the 'Standard Candle'
In a 1904 paper submitted to Astrophysical Journal (ADS:1904ApJ....19..289P) and Harvard Circular No. 78 (ADS:1904HarCi..78....1P), HCO presented Leavitt's work on variable stars in the Orion nebula, confirming 16 variables and discovering a further 73 (55 definitely variable and 18 possible).
Continuing her work with variable stars, in 1908 Leavitt published the 21-page 1777 Variables in the Magellanic Clouds (ADS:1908AnHar..60...87L). At the end of this paper she gave a list of sixteen variable stars, showing their periods and magnitudes, and said:
It is worthy of notice that the brighter variables have the longer periods.
Since no distance scale was then available, the absolute magnitude of variables in the Milky Way could not be estimated from their apparent brightness. However, the absolute magnitude of stars in the Small Magellanic Cloud, being at least approximately the same distance away from the Earth, could be reasonably accurately determined from their apparent magnitude. This allowed Leavitt to make the key observation that the periods of the variables were related to their absolute magnitudes. The results were only based on a sample of sixteen stars, so Leavitt continued to work on making measurements.
In a 1912 article in Harvard College Observatory Circular 173 (ADS:1912HarCi.173....1L) additional observations allowed Leavitt to confirm that there was “a simple relation between the brightness of the variables and their periods” for Cepheid variables. Figures 10 and 11 show the relevant graphs and paragraph from this paper.
One year after Leavitt reported her results, Ejnar Hertzsprung determined the distance to several Cepheids in the Milky Way using parallax measurements; with this calibration, the distance to any Cepheid could be accurately determined. The period–luminosity relationship for Cepheids, properly named "Leavitt's law" since 2008, made these stars the first "standard candle" in astronomy, allowing scientists to compute the distances to galaxies too remote for stellar parallax observations to be useful.
They were referred to as "standard candles" because they were reference objects whose absolute brightness could be computed from their period of variation. Light sources which are further away appear fainter because the light is spread out over a greater area. If we know how luminous a source really is, then its distance can be calculated from its apparent brightness.
After her death, Edwin Hubble used Leavitt’s luminosity–period relation, together with the galactic spectral shifts first measured by Vesto Slipher at Lowell Observatory, to establish that the universe is expanding.
For more on Leavit's work with reference stars and her scientific legacy, read on!
Image Citations
- (1898). Plate a2969. Center for Astrophysics | Harvard & Smithsonian, Photographic Glass Plate Collection, Cambridge, MA.
- Leavitt, H.S. (1906). Henrietta Swan Leavitt Notebooks 1905-1921, Project PHaEDRA (Box 273, Sequence 17), Center for Astrophysics | Harvard & Smithsonian, Cambridge, MA.
- Leavitt, H.S. (1906). Henrietta Swan Leavitt Notebooks 1905-1921, Project PHaEDRA (Box 273, Sequence 17), Center for Astrophysics | Harvard & Smithsonian, Cambridge, MA.
- (1897). Plate b204560. Center for Astrophysics | Harvard & Smithsonian, Photographic Glass Plate Collection, Cambridge, MA.
- (1897). Plate b20678. Center for Astrophysics | Harvard & Smithsonian, Photographic Glass Plate Collection, Cambridge, MA.
- Wargelin, M. (2018). Plate b20560 overlaid on Plate b20678 [Image]. Center for Astrophysics | Harvard & Smithsonian, Photographic Glass Plate Collection, Cambridge, MA.
- Wargelin, M. (2018). Photograph of HCO human computer “fly spanker” [Image]. Cambridge, MA: John J. Wolbach Library.
- Wargelin, M. (2018). Plate b20560 overlaid on Plate b20678 [Image]. Center for Astrophysics | Harvard & Smithsonian, Photographic Glass Plate Collection, Cambridge, MA.
- Leavitt, H. S. & Pickering, E. C. (1912). Periods of 25 Variable Stars in the Small Magellanic Cloud. Harvard College Observatory Circular, 173, 1-3.